ASTM E1382 Determining Average Grain Size Using Semiautomatic and Automatic Image Analysis
Grain size is determined using ASTM E1382, which involves measuring grain intercept lengths, intercept counts, intersection counts, grain boundary lengths, and grain areas. These measurements are taken using either a semi automatic digitizing tablet or automatic image analysis. The final results of this method are displayed keeping in view the international standards and inch-pound units.

TRUSTED BY


Precision-driven testing for dimensional accuracy and compliance
- Overview
- Scope, Applications, and Benefits
- Test Process
- Specifications
- Instrumentation
- Results and Deliverables
Overview
ASTM E1382 defines a method for determining the average grain size of metallic materials using semiautomatic or automatic image analysis systems. It provides a quantitative approach by analyzing digital microstructures, improving accuracy over manual techniques and reducing operator bias in grain size measurement.
The method enhances metallographic evaluation by using computerized image processing to detect grain boundaries and calculate statistical grain size parameters. It is widely used in quality control and research to ensure consistency in material properties, as grain size strongly influences mechanical strength, ductility, and performance of metals and alloys.

Scope, Applications, and Benefits
Scope
ASTM E1382 applies to the determination of average grain size in metallic materials using automated image analysis techniques. It ensures repeatability and objective measurement of microstructural features.
- Determination of grain size using image analysis systems
- Applicable to metals and alloys with distinguishable grain boundaries
- Use of semiautomatic or fully automatic methods
- Quantitative analysis of microstructure
- Reduction of operator subjectivity in measurement
Applications
- Metallographic analysis of metals and alloys
- Quality control in metal manufacturing
- Failure analysis and material characterization
- Research in materials science and engineering
- Evaluation of heat treatment processes
- Aerospace and automotive material testing
Benefits
- Provides objective and repeatable grain size measurement
- Reduces human error and subjectivity
- Enables high-throughput analysis of microstructures
- Improves accuracy of metallographic evaluations
- Supports statistical analysis of material properties
- Enhances consistency in industrial quality control
Test Process
Sample Preparation
Prepare and polish the specimen to reveal clear microstructural grain boundaries.
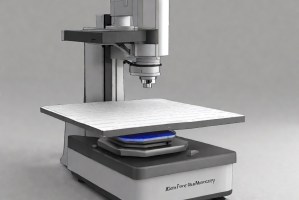
1Image Acquisition
Capture high-resolution micrographs using an optical microscope or imaging system.
2Image Processing
Apply segmentation and boundary detection to identify grains automatically.
3Grain Size Calculation
Compute average grain size using statistical image analysis algorithms.
4Technical Specifications
| Parameter | Details |
|---|---|
| Analysis Type | Semiautomatic and automatic image processing |
| Measurement Parameter | Average grain size |
| Imaging Method | Optical microscopy or digital imaging |
| Resolution Requirement | High-resolution micrographs required |
| Magnification | Typically 50x to 1000x depending on grain size |
| Image Processing | Thresholding and boundary detection algorithms |
| Output Metrics | Grain size distribution and mean grain size |
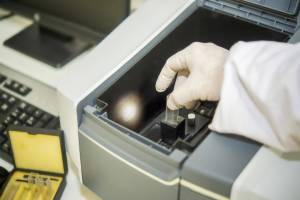
Instrumentation Used for Testing
- Optical microscope with digital camera
- Image analysis software
- Computer with processing capabilities
- Calibration standards (micrometer scale)
- Sample preparation equipment (polishing and etching tools)
- Lighting and imaging control system
Results and Deliverables
- Average grain size value
- Grain size distribution data
- Microstructure images with analyzed boundaries
- Statistical analysis report
- Calibration verification records
- Digital image analysis output files
Why Choose Infinita Lab for ASTM E1382?
With Infinita Lab (www.infinitalab.com), you are guaranteed a Nationwide Network of Accredited Laboratories spread across the USA, the best Consultants from around the world, Convenient Sample Pick-Up and Delivery, and Fast Turnaround Time.
Our team understands the stakes and subtleties of every test. Whether you’re validating a new Product, de-risking a prototype, or navigating complex compliance requirements, our specialists guide the process with rigor and clarity.
Looking for a trusted partner to achieve your research goals? Schedule a meeting with us, send us a request, or call us at (888) 878-3090 to learn more about our services and how we can support you. Request a Quote
Frequently Asked Questions
Image analysis eliminates human subjectivity and provides consistent, repeatable measurements. Manual methods depend heavily on operator interpretation, whereas automated systems apply standardized algorithms, ensuring higher accuracy and statistical reliability in determining grain size across multiple samples.
Segmentation defines grain boundaries in the image. Poor segmentation due to noise or improper thresholding can merge or split grains incorrectly, leading to significant errors in calculated grain size and distribution, affecting the reliability of the analysis.
Proper etching reveals clear grain boundaries. Over-etching can blur boundaries, while under-etching may leave them indistinct. Both conditions affect image analysis accuracy and can lead to incorrect grain size determination.
Automatic systems may struggle with complex microstructures, overlapping grains, or poor contrast images. In such cases, manual intervention or semiautomatic correction may be required to ensure accurate grain identification.
Grain size is represented using average values, distribution histograms, and sometimes standard deviation. This statistical approach provides a comprehensive understanding of microstructural uniformity and variation within the material.

Request a Quote
Submit your material details and receive testing procedures, pricing, and turnaround time within 24 hours.
 Quick Turnaround and Hasslefree process
 Confidentiality Guarantee
 Free, No-obligation Consultation
 100% Customer Satisfaction
